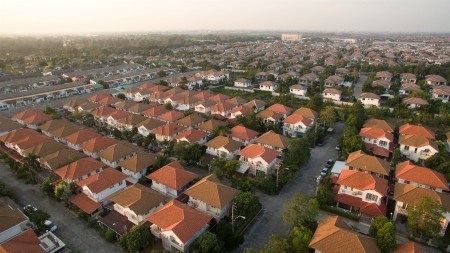
‘While the population has increased by 1,3% per annum over the period 2002-2018, the number of households increased by 2,4% per annum over the same period, a growth of 48,9% over the period,’ says Statistics South Africa’s latest report, the 2018 General House Survey (GHS). What this translates into is 16,7-million households in 2018, versus the 11,02 that existed in 2002.
The GHS, now in its 17th edition, reveals an astounding amount of data that estate agents would regard as relevant to the property market, even though its primary purpose is as an instrument to track the progress of development in the country. Stats SA considers a ‘household’ as individuals who live together under the same roof, and who share resources to keep the household functioning; and for the 2018 GHS, it successfully undertook a total of 21 908 face-to-face household interviews across all nine provinces.
Highlights in this latest report include:
- 25,7% of households consisted of a single person.
- The North West province, at 36,2%, had the highest incidence of single person households.
- Least common, at 19,2%, was the Western Cape.
- 62% of households comprised of three or less members.
- 39,1% of all households were parents and their children.
- 37.6% of households consisted of two generations.
- 14.2% comprised of at least three generations.
- 5.1% were ‘skip generation’ households (grandparents with grandchildren).
- 37,9%, or 6.1-million, of households are headed by females.
- Female-headed households were most common in the Eastern Cape (46,9%), Limpopo (45,8%) and KwaZulu-Natal (45,0%).
- Least common were Gauteng (29,8%) and Western Cape (32,5%).
- 35,3% of individuals owed dwellings, with such ownership more common amongst women (20,6%) than amongst males (15,8%).
- 39.5% of households in urban areas comprised three to four members.
Interesting statistics were also revealed on a province basis. Among those:
- Gauteng had the largest number of households, followed by KwaZulu-Natal, Western Cape and Eastern Cape. Northern Cape, the least populous province, had the smallest number of households.
- Households that lived in rented dwellings were most common in Gauteng (37,1%) and Western Cape (32,5%), and least common in Limpopo (16,5%), Mpumalanga (16,9%) and Northern Cape (18,1%).
- The largest percentage of households that lived in dwellings that were either paid off or being occupied rent-free were found in Limpopo (82,1%) and Eastern Cape (78,3%) while the smallest percentages were observed in Gauteng (50,9%) and Western Cape (55,4%).
Reports like the GHS often confirm the industry’s own analysis or read on the environment and real estate agents can also target their marketing efforts more appropriately and ensure that they understand to whom they are communicating. The GHS for example, also examines language preferences, smart phone use, and service delivery to households, which is particularly important.
Understanding underlying development factors, no matter how vague, also impact on future needs given that circumstances change, particularly as the youth progress through their further educational studies, secure jobs and fulfil aspirations to be home-owners. Whether we have enough homes to offer them, within the right price range is another issue entirely, but it seems that the trends identified in the 2018 GHS will continue through, at least, 2019 given that the economic circumstances of the country have changed very little in the past 12 months.


