|
Price Deflation continues to deepen, despite early indications that market demand conditions may be starting to improve |
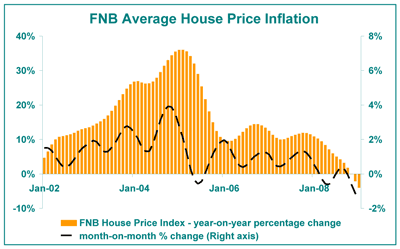
The year-on-year decline in the FNB House Price Index continued in January, from a December revised rate of –2.1% to -4.0%. This is the third consecutive month of average year-on-year house price deflation, and this situation of national house price decline is expected to continue for most of 2009. On a month-on-month basis -1.4% deflation was recorded, worse than the revised -1.1% of the previous month. This ongoing deflation is the lagged response to a decline in demand dating back to 2007, and it is expected that the deflation situation could be with us for much of 2009. Strain In The Smaller-Sized “2-Bedroom And Less” Market Still Appears To Be Worse Than The 3-Bedroom MarketThe market for 2 Bedroom houses and less is where the weakness continues to appear worse than in the case of the 3 Bedroom market. For the 3 month period to January, the average freehold 2 Bedroom house price (R321,518) declined by -12.3% year on year. This represents a deterioration from -8.1% year-on-year deflation in the previous 3-month period. The sectional title “2 Bedroom and less” market continued to fare slightly better but nevertheless continued with average price deflation in the 3 months period to January 2009 as well. The average price of sectional title 2 Bedroom houses (611,396) declined by -0.6% year-on-year, while the average price of sectional title units with less than 2 Bedrooms (R430,237) depreciated by -5.9%. The 3 Bedroom market still managed to remain in low year-on-year house price inflation in the 3 months to January, although also on a slowing trend. The average price for sectional title 3 Bedroom units (R930,709) showed year-on-year price inflation of 4.6% in the 3 month period to January, down from 5.5% in the previous 3 month period, while the average price of the mildly more affordable freehold 3 Bedroom category (R831,734) inflated by 6,1%, down from 8.1%. 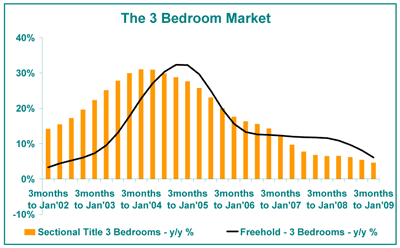
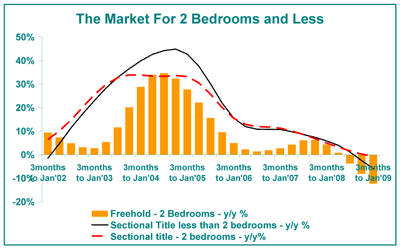 It has been previously explained that the possible reason for the apparent superiority in performance of the 3 Bedroom market compared to 2 Bedroom and less sectional title property, is that much of the buy-to-let surge back in the boom years was focused on the sectional title 2 Bedroom and less market, as was much of the first time buying attention that we saw at the time. That may have explained the sectional title market for 2 Bedroom units and less showing the highest price inflation of all of the major categories back at the peak of the boom around 2004/05. But it was also mentioned that, buy-to-let buying and first time buying has a tendency to be more cyclical than the more essential primary residential buying. Hence, a more extreme pull back in buy-to-let and first time buying in the bad times (compared with established family primary residential demand) may be the driving force behind the “2 Bedroom and less” market now performing worse than the 3 Bedroom market. The 3 Bedroom market is probably a more primary residential buyers’ market, driven by family demand.
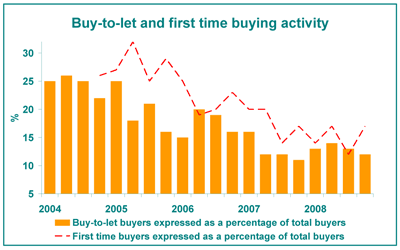
FNB’s 4th Quarter Residential Property Barometer, for which the results were released last week, showed a slightly encouraging sign for the smaller-sized part of the sectional title market in that first time buying activity as a percentage of total buying was believed to be up, from a previous 12%, to 17% in the final quarter, according to estate agents surveyed. The buy-to-let percentage on the other hand still remained subdued. It must be said, though, that the first time buying estimate by agents is a volatile one from quarter to quarter, and one will have to wait for a few more quarters to see if any trend has started.
With interest rates starting to decline, it is plausible to expect that the more cyclical first time buying ratio may start to improve, and this should benefit the sectional title 2 Bedroom and less market more than it would the 3 Bedroom market.*Note: While other room size categories not mentioned are included in the overall price index, their sample sizes are believed to be too small to justify the compilation of their own price index Real Price Deflation Unchanged From November To December 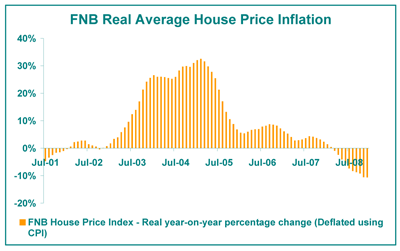
In real terms, when adjusted for general inflation by using the Consumer price Index (CPI), house price deflation remained constant at -10.6% year-on-year from November to December 2008. This was due to a significant decline in consumer price inflation from 11.8% in November to 9.8% in December, which offset the effect of declining nominal house prices. Accompanying the house price deflation situation in 2009, consumer price inflation, too, is expected to decline steadily for much of the year on the back of sharply lower commodity prices.
Outlook For 2009While a few encouraging signs in the residential market have emerged, it is believed that year-on-year national price deflation will still be with us for most of 2009. CPIX inflation has begun to fall more rapidly, with the latest December 2008 number coming out at 10.3%, down from 12.1%, while the re-weighted January inflation promises more decline. As the SARB meets for its bi-monthly Monetary Policy Committee meeting on Wednesday and Thursday this week, the debate is not about whether it will reduce interest rates or not, but rather will it be a 50 basis point cut or perhaps 100 basis points? This is reflective of a dramatically improved inflation environment, on the back of sharp recent global commodity price declines, and the new CPI measure is expected to be back in the SARB’s 3% to 6% target range by the third quarter of this year. 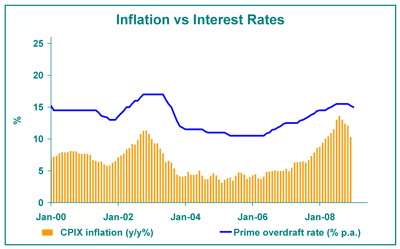
Against the positive of declining interest rates, though, we have the spectre of slow economic growth with the poor job creation prospects that it brings. While growth should receive some stimulus from falling interest rates, it will face challenges for as long as the global economy remains in its slump, and that could be for some time. Nevertheless, being a very interest rate-sensitive market and thus tending to lead the economic cycle along with vehicle sales, residential demand is expected to respond positively (albeit gradually) to the expected series of interest rate cuts despite weak economic growth. The negative growth rate in new mortgage loans is thus expected to show improvement from early this year, a reflection of improving demand conditions.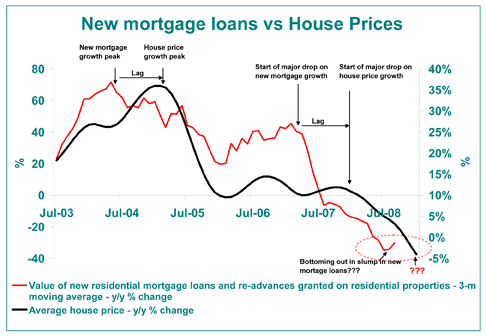 However, house price inflation trends generally only change direction with a considerable lag in responding to demand trend changes. It is believed that there is something of an oversupply in the market, with much selling in order to downscale due to financial pressure (not to mention sales in execution at relatively high levels) and a gradual recovery in demand would probably still take a considerable amount of time to mop up the oversupply.
If one examines this graph, one can see the lag between the last peak in new mortgage loans growth back in the first half of 2004 and the resulting peak in house price inflation early in 2005. Around mid 2007 the decline in new mortgage loans growth noticeably picked up downward speed, while house price inflation’s demise picked up speed only in 2008. The same type of lag is anticipated again in 2009 following a gradual improvement in demand, and this leads to the expectation that national house price inflation could only resume in 2010.
